Quickstart
This guide will show how to configure, plot and archive basic Very Low Frequency Sudden Ionospheric Disturbance data produced by the Stanford SID & SolarSID Monitors.
Installation
pip install git+https://github.com/TCDSolar/SIDpy
Plotting data
Once installed, SIDpy may be imported into any standard Python3 script.
import sidpy.run as sid
Example data may be obtained from the Dublin Institute for Advanced Studies at https://vlf.ap.dias.ie/data using the
following code snippet,
import pandas as pd
import requests
from pathlib import Path

url = 'https://vlf.ap.dias.ie/data/dunsink/super_sid/2021/04/22/csv/Dunsink_HWU_2021-04-22_000000.csv'
req = requests.get(url)
url_content = req.content

file = 'Dunsink_HWU_2021-04-22_000000.csv'
csv_file = open(file, 'wb')
csv_file.write(url_content)
csv_file.close()
Once Obtained Sidpy may then be used to plot and archive all data contained within a directory:
sid.process_directory([Path.cwd()], Path.cwd() / './data')
Or just a single file:
sid.process_file(Path(file), Path.cwd() / './data')
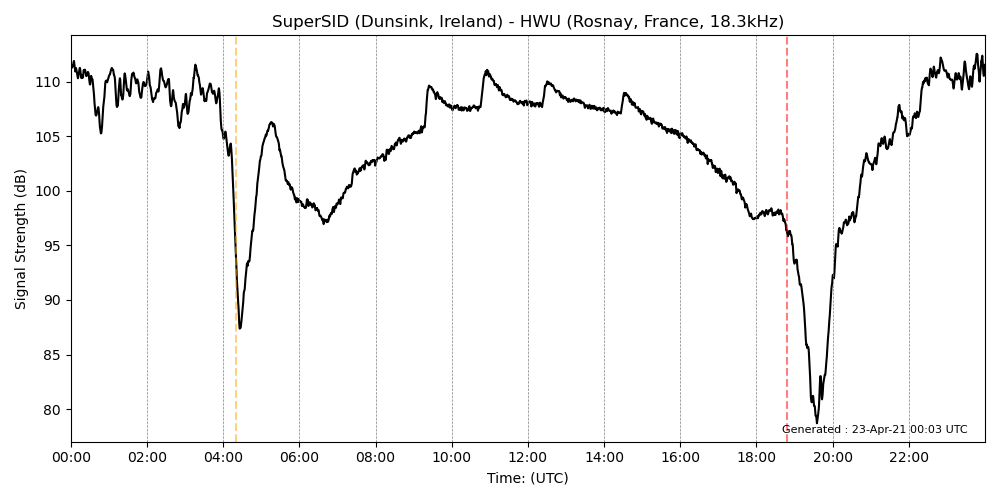
In both cases the data and processed pngs should be found at
./data/dunsink/super_sid/2021/04/22/png/Dunsink_HWU_2021-04-22_000000.png: